
LOCAL SEARCH RESOURCES
Read local visibility data without overreading it.
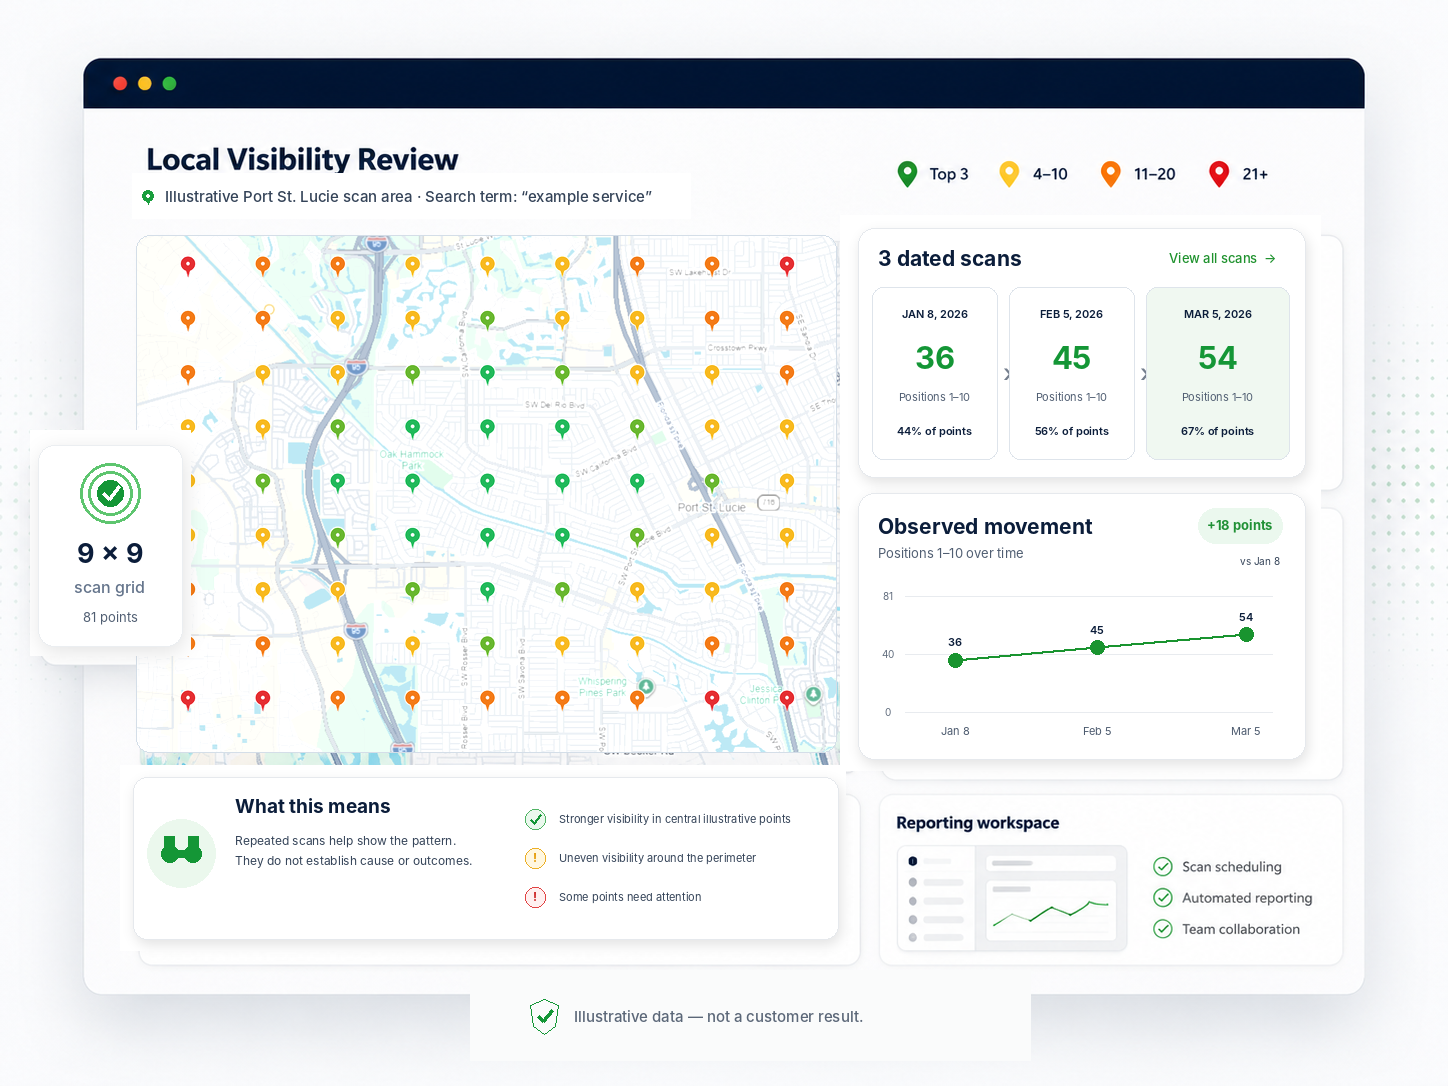
A geographic scan shows how visibility varies across an area. Repeated scans with the same settings can reveal patterns worth investigating, but they do not prove future rankings or business outcomes.
Illustrative data. No customer or tenant data is used.
MANAGED LOCAL VISIBILITY
Know what was done, what needs input, and what happens next.
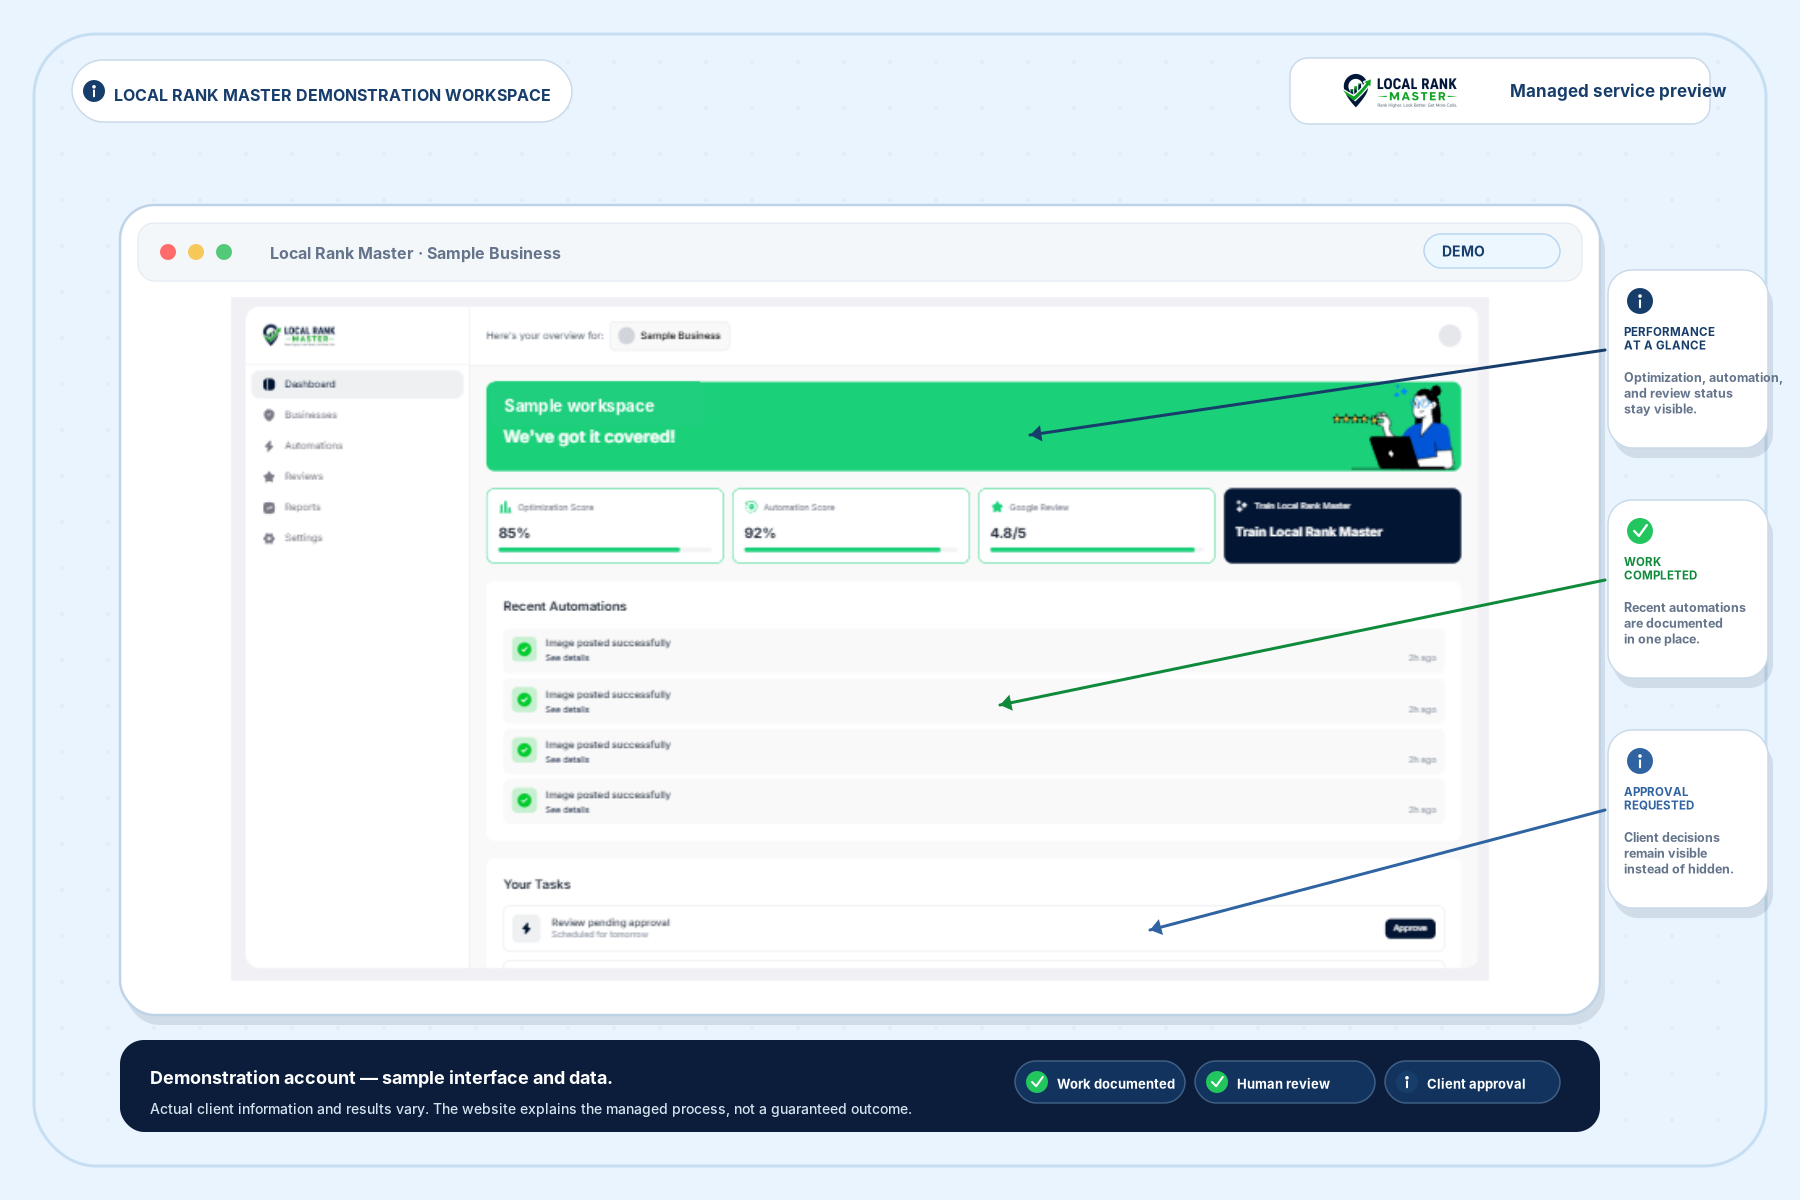
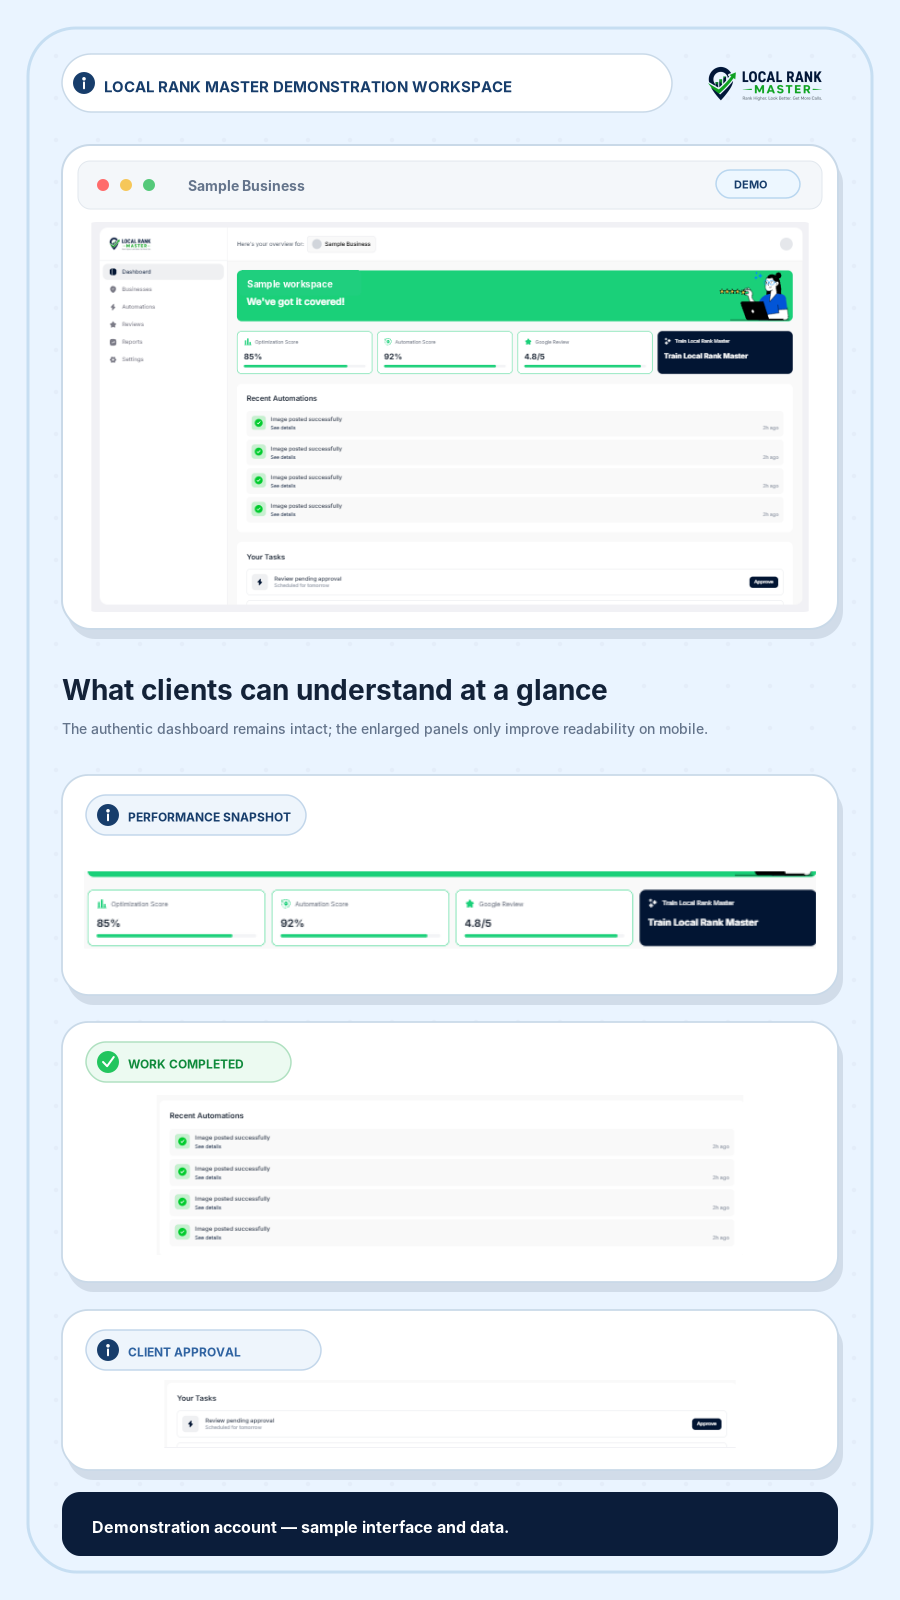
The workspace brings completed work, approvals, open issues, and measurement into one view. That makes it easier to separate routine activity from items that need a decision.
- Completed work is documented
- Approvals and client input are surfaced
- Open issues stay visible until resolved
Demonstration account — sample interface and data.
PROFILE + REPUTATION
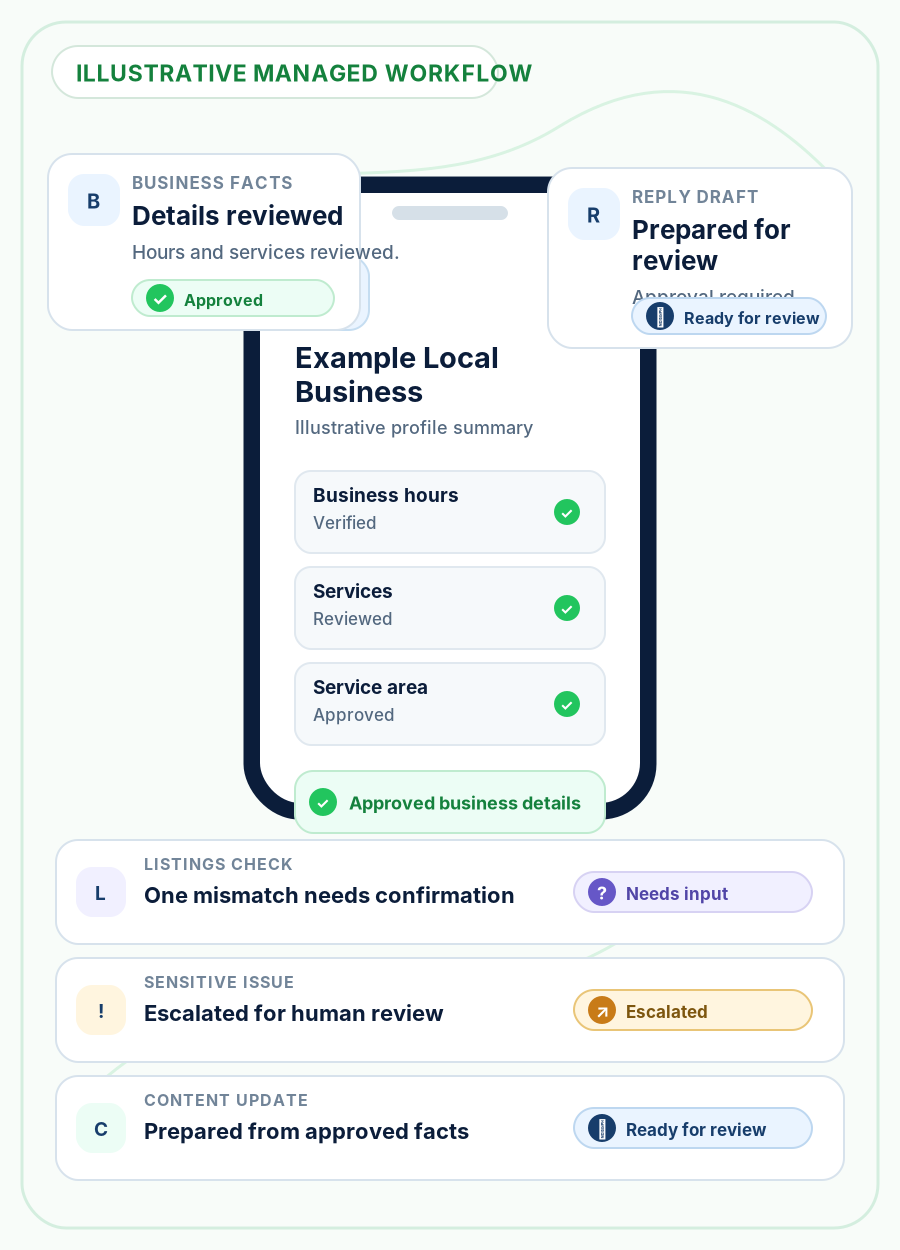
Keep approved facts consistent—and exceptions visible.
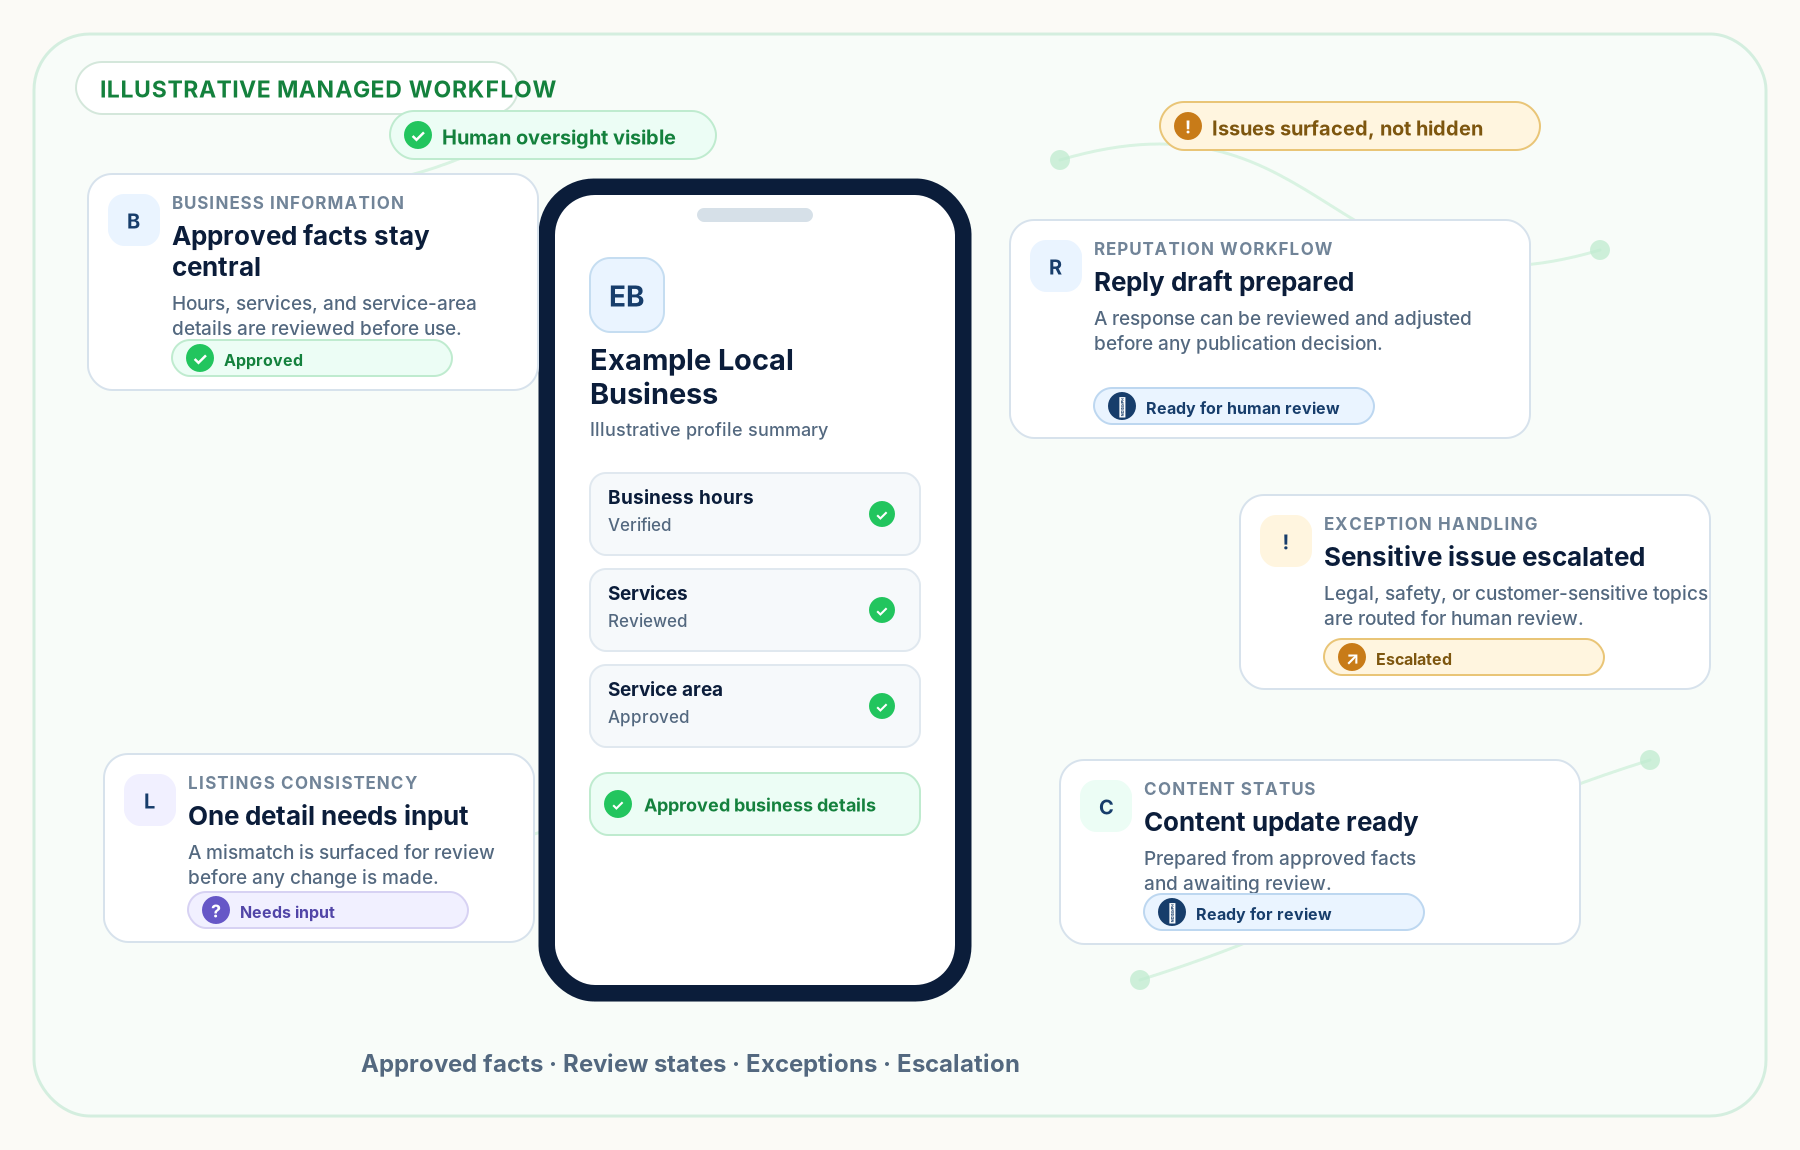
Profile details, review responses, listing checks, and content updates should use the same approved business information. Drafts can be reviewed, missing input can be requested, and sensitive issues can be escalated before publication.
- Approved business facts stay central
- Drafts and exceptions receive review
- Sensitive issues are escalated
Illustrative managed workflow.
VISIBILITY + REPORTING
See what was measured, what changed, and what deserves attention next.
Repeated scans are comparable only when the query, center, grid dimensions, point spacing, and layout remain consistent. A useful review reports the full pattern, notes mixed or uneven movement, records completed work alongside the measurements, and identifies the next questions without claiming causation.
- Same settings each scan
- Mixed movement reported honestly
- Issues and next priorities identified
Illustrative data — not a customer result.

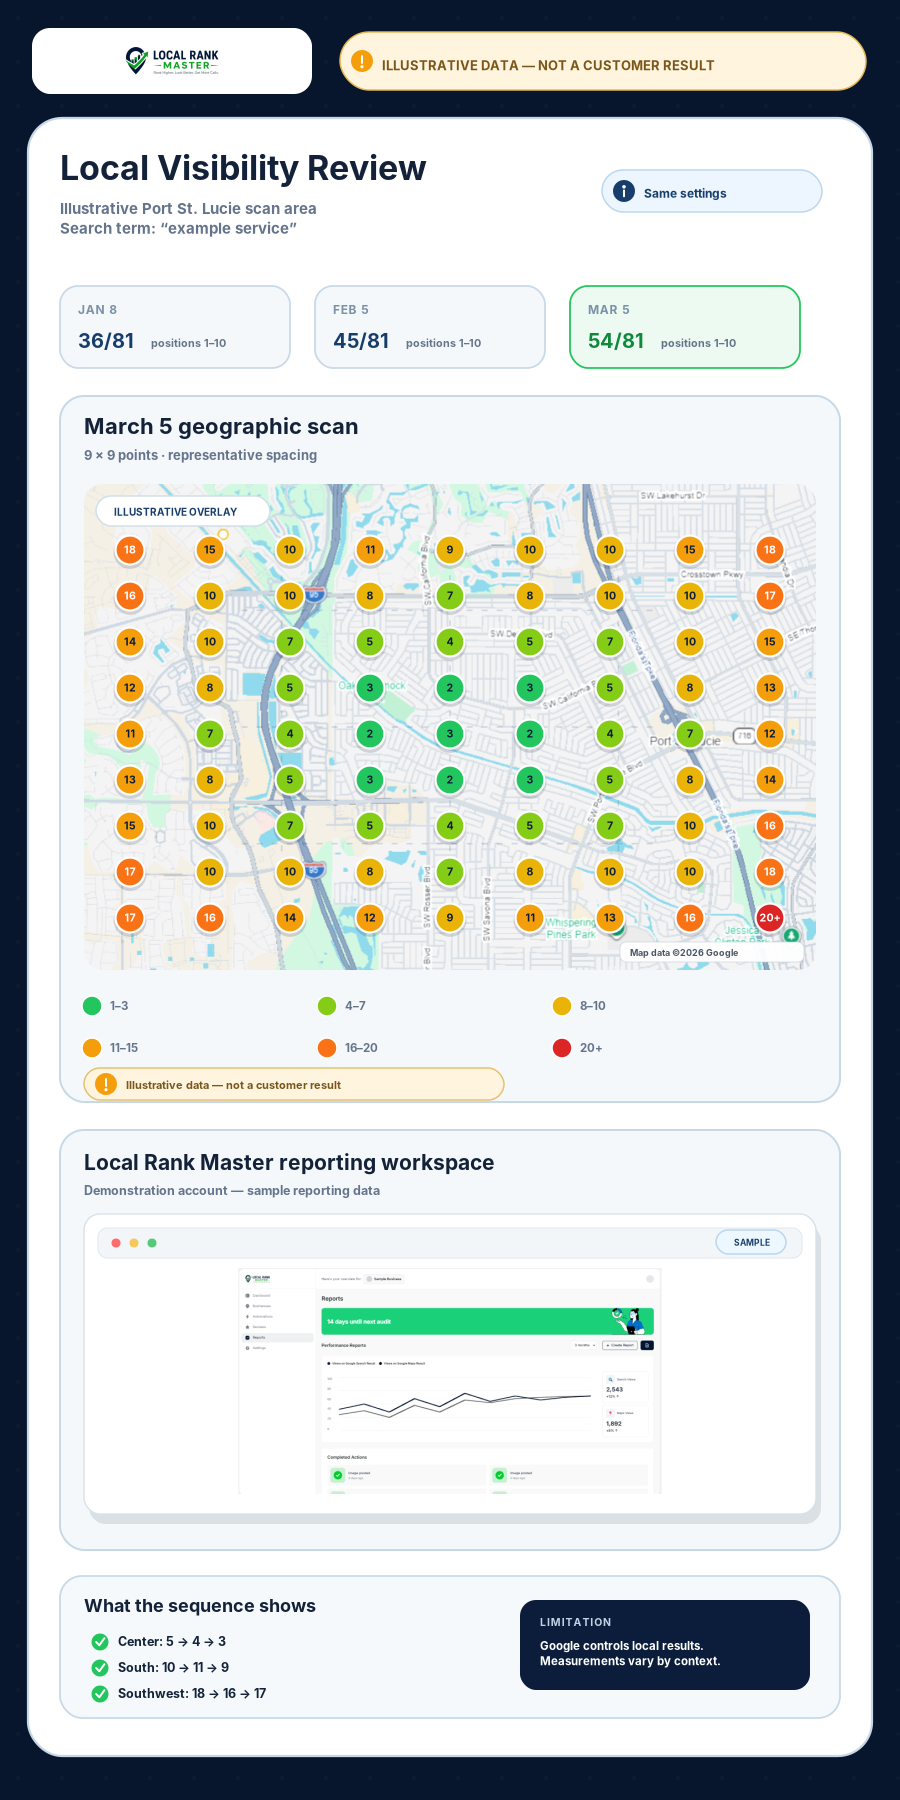
The reporting interface shown is a demonstration account with sample reporting data.
METHODOLOGY + ACCESSIBLE EVIDENCE
Keep the evidence available without letting it interrupt the story.
The dates, query, geographic context, grid settings, summary counts, and non-color equivalents remain available below. Open any dated scan to review all 81 recorded values.
Illustrative data — not a customer result.
- Search term
- “example service.”
- Geographic context
- Illustrative Port St. Lucie scan area
- Grid
- 9 × 9
- Points per scan
- 81
- Comparison settings
- Same query, center, grid dimensions, point spacing, and point layout
Scan summary
| Scan date | Positions 1–10 | Total points |
|---|---|---|
| 36 | 81 | |
| 45 | 81 | |
| 54 | 81 |
Example point sequence
| Point | |||
|---|---|---|---|
| Center | 5 | 4 | 3 |
| South | 10 | 11 | 9 |
| Southwest | 18 | 16 | 17 |
Complete numerical equivalent
Open any dated scan to review all 81 recorded values. Rows run north to south and columns run west to east; “20+” is retained exactly as supplied.
36 of 81 points in positions 1–10
| Row | 1 | 2 | 3 | 4 | 5 | 6 | 7 | 8 | 9 |
|---|---|---|---|---|---|---|---|---|---|
| 1 | 18 | 15 | 11 | 11 | 11 | 11 | 11 | 15 | 18 |
| 2 | 16 | 11 | 11 | 11 | 7 | 11 | 11 | 11 | 17 |
| 3 | 14 | 11 | 7 | 5 | 4 | 5 | 7 | 11 | 15 |
| 4 | 12 | 8 | 5 | 3 | 2 | 3 | 5 | 8 | 13 |
| 5 | 11 | 7 | 4 | 2 | 5 | 2 | 4 | 7 | 12 |
| 6 | 13 | 8 | 5 | 3 | 2 | 3 | 5 | 8 | 14 |
| 7 | 15 | 11 | 7 | 5 | 4 | 5 | 7 | 11 | 16 |
| 8 | 17 | 11 | 11 | 8 | 7 | 8 | 11 | 11 | 18 |
| 9 | 18 | 16 | 14 | 12 | 10 | 11 | 13 | 16 | 20+ |
45 of 81 points in positions 1–10
| Row | 1 | 2 | 3 | 4 | 5 | 6 | 7 | 8 | 9 |
|---|---|---|---|---|---|---|---|---|---|
| 1 | 18 | 15 | 11 | 11 | 9 | 11 | 11 | 15 | 18 |
| 2 | 16 | 11 | 10 | 8 | 7 | 8 | 10 | 11 | 17 |
| 3 | 14 | 10 | 7 | 5 | 4 | 5 | 7 | 10 | 15 |
| 4 | 12 | 8 | 5 | 3 | 2 | 3 | 5 | 8 | 13 |
| 5 | 11 | 7 | 4 | 2 | 4 | 2 | 4 | 7 | 12 |
| 6 | 13 | 8 | 5 | 3 | 2 | 3 | 5 | 8 | 14 |
| 7 | 15 | 10 | 7 | 5 | 4 | 5 | 7 | 11 | 16 |
| 8 | 17 | 11 | 10 | 8 | 7 | 8 | 10 | 11 | 18 |
| 9 | 16 | 16 | 14 | 12 | 11 | 11 | 13 | 16 | 20+ |
54 of 81 points in positions 1–10
| Row | 1 | 2 | 3 | 4 | 5 | 6 | 7 | 8 | 9 |
|---|---|---|---|---|---|---|---|---|---|
| 1 | 18 | 15 | 10 | 11 | 9 | 10 | 10 | 15 | 18 |
| 2 | 16 | 10 | 10 | 8 | 7 | 8 | 10 | 10 | 17 |
| 3 | 14 | 10 | 7 | 5 | 4 | 5 | 7 | 10 | 15 |
| 4 | 12 | 8 | 5 | 3 | 2 | 3 | 5 | 8 | 13 |
| 5 | 11 | 7 | 4 | 2 | 3 | 2 | 4 | 7 | 12 |
| 6 | 13 | 8 | 5 | 3 | 2 | 3 | 5 | 8 | 14 |
| 7 | 15 | 10 | 7 | 5 | 4 | 5 | 7 | 10 | 16 |
| 8 | 17 | 10 | 10 | 8 | 7 | 8 | 10 | 10 | 18 |
| 9 | 17 | 16 | 14 | 12 | 9 | 11 | 13 | 16 | 20+ |
HOW TO READ THE MEASUREMENTS
Use the pattern to ask better questions—not to make promises.
Google controls local results, and measurements vary by location, device, time, personalization, competition, query, business eligibility, and platform changes.
-
A scan is location-specific
It records visibility from defined points under defined settings; it is not a universal ranking.
-
Movement is not causation
A sequence can show change, but it does not prove what caused that change.
-
Visibility is not a business outcome
Scans do not establish calls, leads, customers, revenue, or ROI.
READY TO APPLY THE LESSON?
Review your own visibility with the same discipline.
A Free Local Visibility Audit can show how your business appears across an agreed area and highlight the questions worth investigating next.
You’ll continue to the Local Rank Master audit portal.